Trading with Machine Learning
I took Machine Learning for Trading Summer 2020. The final project consisted of a manual strategy based on hard-coded indicator threshold values and a Strategy Learner bot that used random forests to generate trading decisions based on calculed indicators. In Part I, the indicator calculations are discussed in detail. Here, we’ll talk through three strategies - the theoretically optimal strategy, a manual strategy and machine learning strategy.
Indicators for Trading
The basis for both the Manual Strategy and the Machine Learning strategy were stock indicators. In this project, we’ll only be using three of the five indicators calculated in Part I. The reason for this will be discussed in more detail below.
All of the indicators have both a continuous value and what I’m calling a signalized value where I set thresholds to return either a +1 (BUY), -1 (SELL), or 0 (HOLD). Because of various project constraints set by the teaching staff, this signalized column is calculated outside of the indicator code.
def signalized(df, col_name, upper_thresh=1, lower_thresh=-1):
    """
    Replace a column name with the signal version
    Replaces everything above upper_thresh with +1 and everything below with -1.
    Os for everything else.
    """
    signal = df[col_name].copy()
    signal[:] = 0
    signal[df[col_name] <= lower_thresh] = -1
    signal[df[col_name] >= upper_thresh] = 1
    df[col_name] = signal
    return df
Some Project Constraints
Before we get into the details of the strategies, I’ll cover some project constraints from the teaching staff.
- We’re only trading one stock symbol (no portfolio optimization)
- No limits on leverage
- Only allowable positions are +1000/-1000/0 shares
- Max allowable trades are +2000/-2000 to maintain the above position
- The input is a price dataframe indexed by date listing adjusted prices for a stock.
- The output is a pandas dataframe indexed by date listing trade values.
- Both manual and machine learning strategies must use the same indicators.
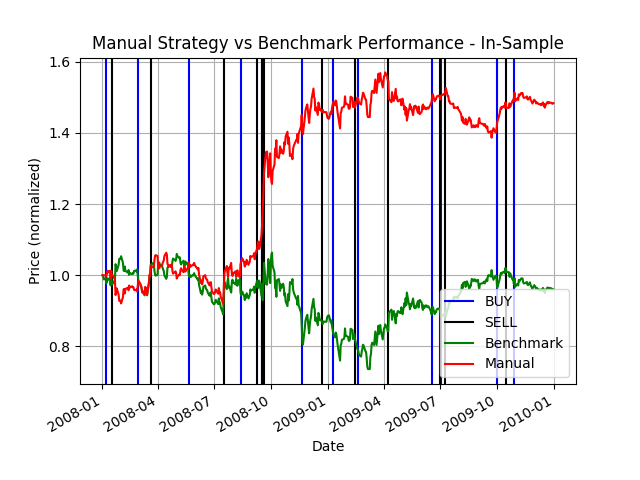
Manual Strategy
The Manual Strategy is a trading strategy that uses the signalized version of three indicators - Bollinger Bands, Stochastic Oscillator, and MACD.
A date range and symbol are passed into the ManualStrategy constructor. The three indicators are added to the dataframe and signalized to be either +1, -1, or 0.
To determine whether we should trade based on these three signal values, I used a weighted sum approach.
The weights were found by running a basinhopping algorithm and optimizing the weights for each signal to maximize returns. This is why I restricted my decision making to only three signals. While using all five indicators, I found that RSI and OBV were returning weights near 0. Clearly these indicators were not contributing to the output so I eliminated them entirely.
This algorithm takes a while and the project has defined symbols and date ranges. For this reason, the allocations that are returned from basinhopping were hardcoded for the project. If this strategy were being applied in a real application, I would run the allocation optimization to train the algorithm once, then use those allocations for the testing phase.
Once we have the optimal weights and have generated a signal column, we can use the prices dataframe to output a trading dataframe.
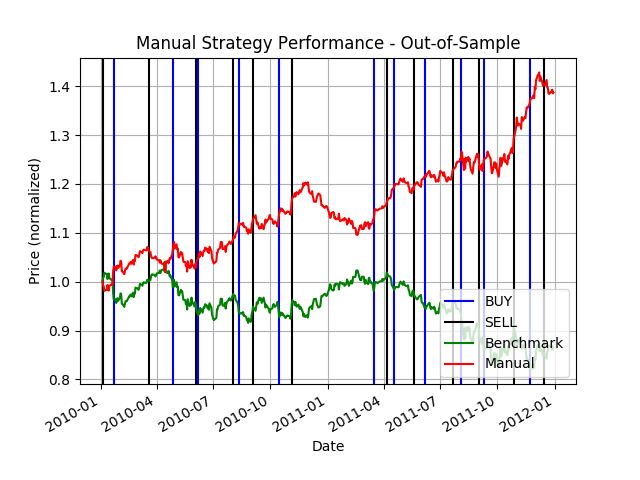
This trader actually performs pretty well, both with in-sample data and with out-of-sample data.
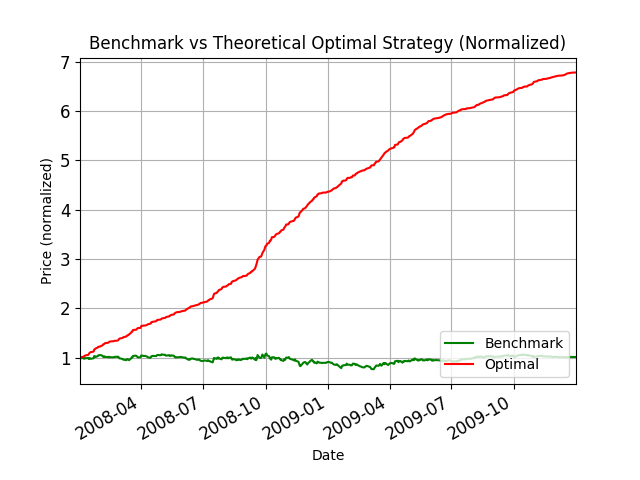
Theoretically Optimal Strategy
The TOS is an important aspect that we must figure out before we use our strategy learner. This is because we need to use the TOS to classify our daily prices/indicators as either a buy/sell or hold and we will use the classifications generated by the TOS to do this.
When we train the decision tree, we use a date range in the past so that we can see the future. When you can see the future, generating the optimal strategy is as simple as buying before the price rise and shorting/selling before the price drops. Because we can sell AND short the stock, our optimal strategy is simple:
- When the future price will rise, buy the maximum number of shares.
- When the future price will fall, sell all the available shares and short the maximum number of shares
- Hold each stock for as long as the current trend continues (hold a short when the price is going down on successive trading days, hold a long position when the price goes up on successive trading days)
- If the price does nothing between days, hold the current position.
To calculate this strategy in terms of a trading dataframe, first we gather the price data and generate a dataframe that calculates the difference between prices on successive days. Whenever the change is negative, we replace it with -1,when it’s positive, we replace it with +1. To capture the buy opportunities, we need to capture the positive changes and the sell/short opportunities which are the negative changes (stock price is decreasing). We only need to trade on the days where there is an inflection in the change (from positive to negative or vice versa).
If we plot the performance on the TOS vs a benchmark of buying and holding, we can see that you can generate massive returns if you can see the future!
Strategy Learner
The strategy learner uses a bagged learner with 50 bags composed of decision trees with a leaf size of 5.
Each feature row is a vector of indicators described above. The labels for each row were generated from the TheoreticallyOptimalStrategy learner discussed above. The training data was analyzed using this optimal strategy which, with perfect knowledge of the future, will determine what day the learner should trade and in which direction. The goal is to allow the learner to associated certain indicator values with buy/sell signals. The buy/sell signal threshold was optimized for both the in-sample and out-of-sample cumulative returns. CR values above YBUY classify the day as a +1 BUY signal, values below YSELL classify the day as -1 SELL.
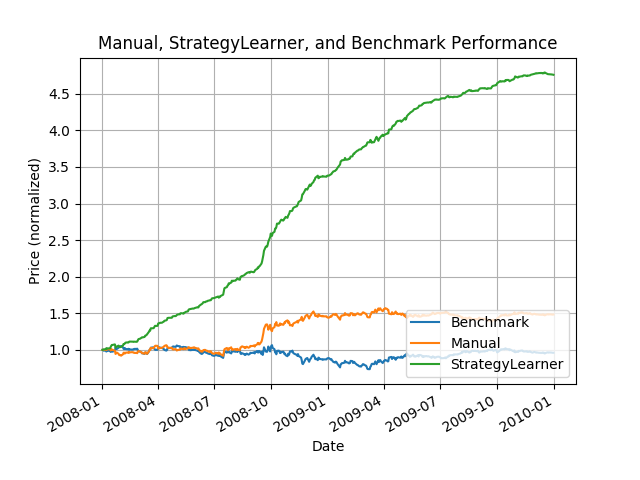
Not suprisingly, the machine learning algorithm learns the proper buy/sell signal for in-sample data and generates shockingly good returns. Also not suprisingly, the learner performs poorly on out-of-sample data. It’s not really clear why, but the class does not require analysis of of out-of-sample results, probably because they’re almost universally bad. This makes sense - otherwise any masters student could game the market and generate huge returns.
The Impact of Impact
An interesting adjustment to the TOS is to consider adding trading impact to the strategy. This means that on every trade, you lose a little bit to market mechanics. The idea is to simulate the market moving while you’re trading. Typical values for impact might be 0.005.
The TOS was updated to account for impact by making a trading decision of a BUY/SELL only if the gain from the trade would offset the loss due to impact. The hypothesis is that a machine learning trading algorithm that considers impact will only trade on days when it believes the trade gain will offset the impact loss, thus reducing the total number of trades made over a time period.
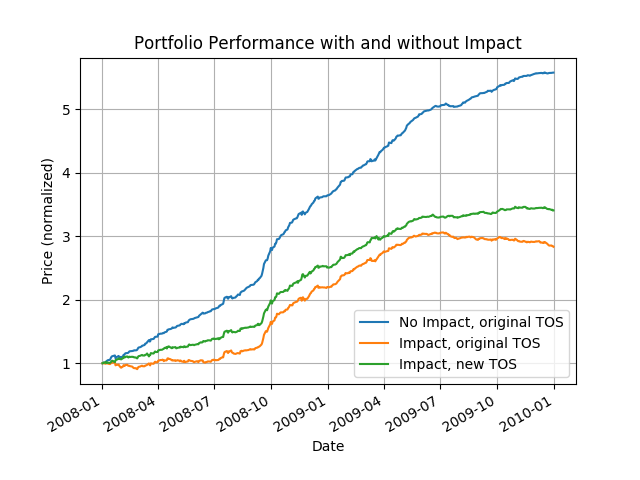
Comparing three different strategies, we can see how a learner that considers impact trades differently and how that affects the total returns. three strategy Learner 1 has no impact and is trained with the old TOS. Learner 2 has an impact value of 0.010 and is trained with the old TOS. Learner 3 has an impact of 0.010 and is trained with the new TOS that considers impact.
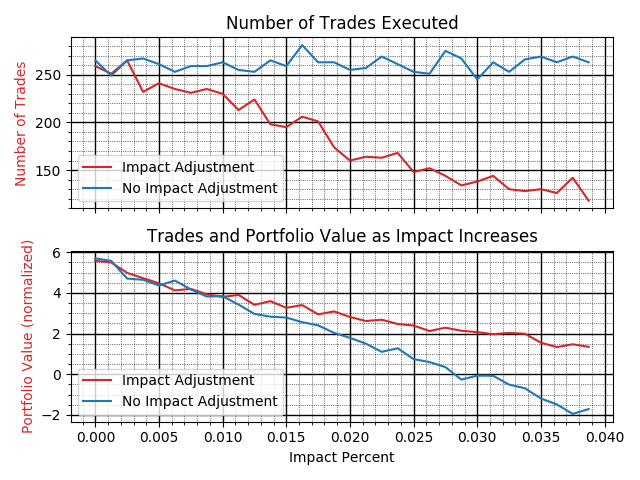
Varying the impact through a set range, we can see when the new strategy eclipse the old in terms of returns. We can also see how the number of trades decreases as the impact amount increases:
Project Reports
See the links below for my final report.